In the summer term 2018 I did a group project for a course, which had the option to take part in the Graph Drawing Conference creative topic contest. Following is some of the thought process we had while creating the poster.
The International Symposium on Graph Drawing and Network Visualization describes itself as:
Graph Drawing is concerned with the geometric representation of graphs and constitutes the algorithmic core of Network Visualization. Graph Drawing and Network Visualization are motivated by applications where it is crucial to visually analyze and interact with relational datasets. Examples of such application areas include data science, social sciences, Web computing, information systems, biology, geography, business intelligence, information security and software engineering.
Each year they organize a contest with different topics. One such creative topic was to design a poster of the relationship graph of Game of Thrones characters. They provided a .graphml file based on important characters and their relationship after season 7.
Each node in the graph is a character and has different attributes assigned.
- status - Alive or deceased.
- house-birth - The house a character is born into.
- house-marriage - The house a character marries into.
- group - If a character belongs to a group which is not a house.
Each edge states a relationship between two characters and has also different attributes assigned. Edges can be either directed or undirected.
- death - Directed edge which states source character killed target character.
- father - Directed edge which states source character is the father of target character. This can have a attribute attached if the relationship is legal or biological.
- mother - Similar to father.
- siblings - Undirected edge which states two characters are siblings.
- lover - Undirected edge which states two characters are lovers.
- spouse - Similar to lover, but may also mean a "have-been".
- allegiance - Directed edge that states source character pledged allegiance to target character.
All in all there are 84 nodes (characters) and 216 edges (relationships). If you are not familiar with graph drawing, this number doesn't seem much at first, but to find a visually pleasing layout while containing all the information is quite hard. We started with preprocessing the graph in the yED graph editor, a tool to visualize graphs with several layouting options.

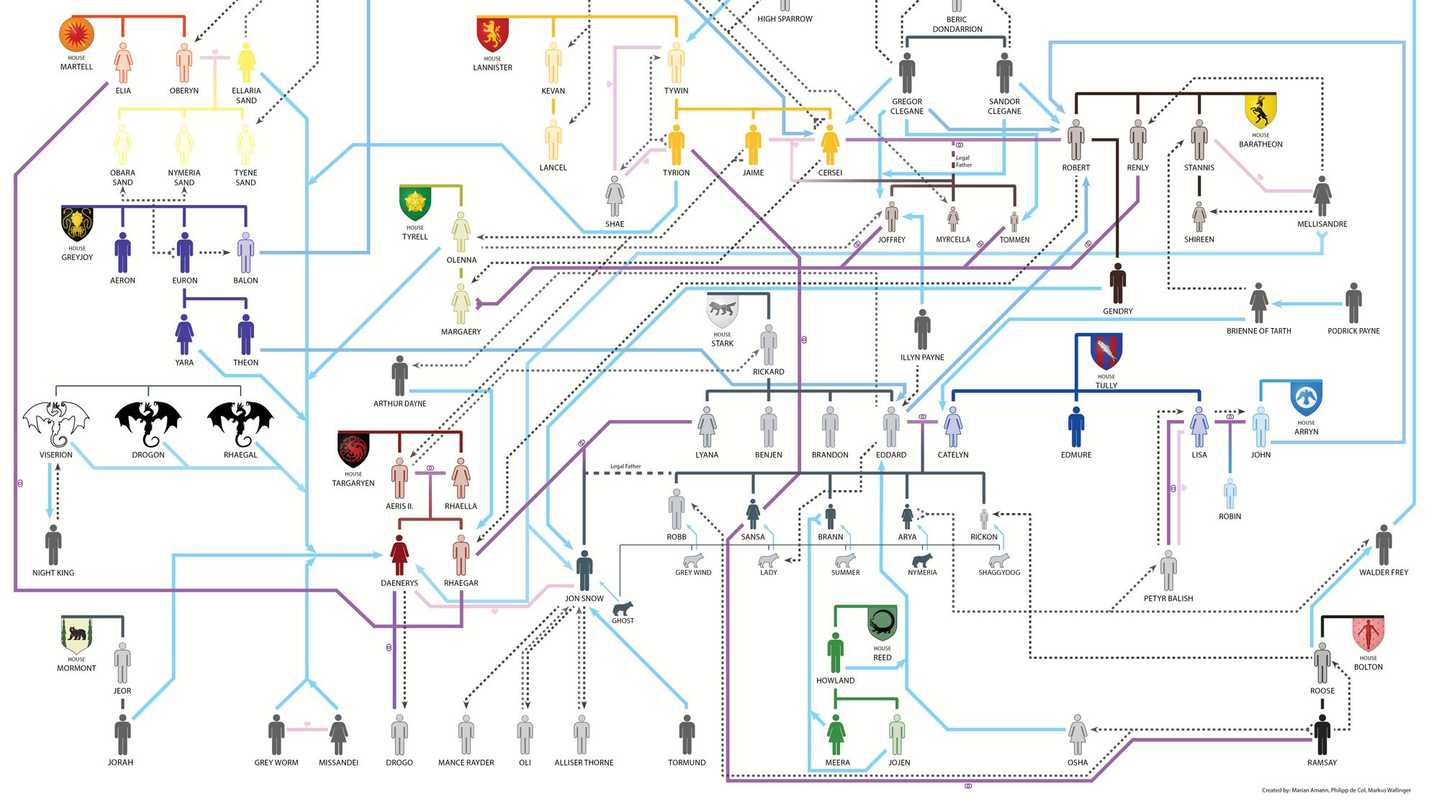
Automatic layouting however does not produce good layouts in this case and we scraped most of the stuff we had at that point and concentrated on what we learned from these experiments. There are several clusters of nodes in the graph which are closely linked via relationship edges, most notably from the family type (mother, father, sibling, married, lovers). The number of edges between those clusters are much smaller and mostly consist of killed by or pledged allegiance to relationships. We arrived at the idea to include a family tree to cover the relationships of a house and tried to find placements for the house clusters which minimized edge crossings to the remaining houses. We tried placing the houses radially around an invisible oval and have mostly straight edges between houses, but we scraped this idea because we got to many crossings which where hard to follow. Finally we decided to follow octolinear layout constraints, similar to metro maps for relationship edges. Octolinear means that an edge can only be drawn, with or without bends, in 8 directions (horizontally, vertically, or diagonally). We placed the house clusters to minimize edge crossings and arrived at following layout:

For designing the poster we settled on Adobe InDesign. The color choices for each character where guided by Google's Material Design and the main color associated with the coat of arms of the house. The house relationships where drawn as a simplified family tree and members which married into a house are indicated by a color gradient. We used different line styles to encode the type of relationship. The gender and status of a character where encoded by the silhouette. Several long edges exist and some of them are from one character to many. We tried to bundle such edges and indicate reading direction with arrows. The color values of edges of the same type which are parallel are slightly different to increase readability.


Overall this was one of the most interesting projects during my time at the university. Our poster made second place in the competition and was overall well received. The problem statement and the provided data was for some cases inconsistent and viewers of the TV show or readers of the book will probably spot the irregularities.

...
Last Update: